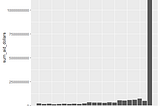
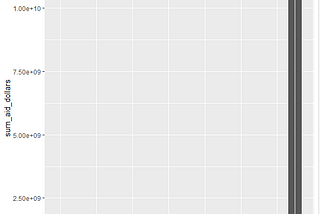
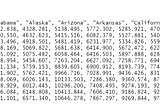
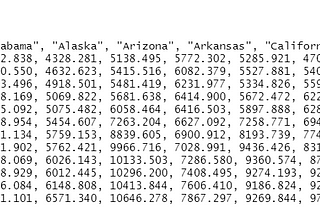
Zaynaib GiwaReadable x/y axis for plots made in RIn my last tutorial, I turned off the scientific notation display using the global function options. The y-axis is more readable than…2 min read·Aug 4, 2023----
Zaynaib GiwaHow to turn off Scientific notation in RIf you are creating a chart with ggplot that has huge numbers it's a high chance that R will set those numbers into scientific notation…1 min read·Jul 17, 2023----
Zaynaib GiwaReview: Going from Beginner to Advanced in ggplot2 — Udemy CourseHi, it’s me Ola. It’s been a while since I’ve made a blog post. It's been about 3 years to be exact. Let me re-introduce myself. I am a…2 min read·Jun 1, 2023----
Zaynaib GiwaTidy Tuesday — Tuition DataTidy Tuesday is a weekly mini data science challenge. Its a great way to practice your data analytics skills without feeling overwhelmed…4 min read·Mar 29, 2022----
Zaynaib GiwaDigital Minimalism in Data ScienceAt the beginning of the New Year, I did something that was cliche. I read books about productivity. These books were Cal Newport's Digital…2 min read·Feb 9, 2022--1--1
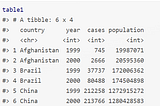
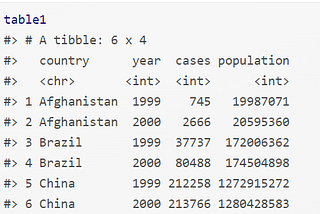
Zaynaib GiwaHow to get started performing Tidy Analysis in RStatistics is the science of learning from data4 min read·Nov 6, 2021----
Zaynaib GiwaDay 2 — 66 days of dataYesterday I learned that the first step of mastering statistics is to master the art of exploring data.1 min read·Feb 3, 2021----
Zaynaib GiwaDay 1 of 66 Days of Data ScienceFor the 66 days of data science challenge, I am going back to the basics and relearning statistics. I am using a textbook titled…1 min read·Feb 1, 2021----
Zaynaib GiwaStarting #66DaysofData JourneyAt the beginning of the year, I stumbled upon the hashtag #66DaysofData on Twitter. After doing some investigation it's the same concept…3 min read·Jan 31, 2021----
Zaynaib GiwavisFest 2019This week I got the privilege to attend visFest this week which was held in Chicago. It was a surreal experience getting to meet data…4 min read·Aug 28, 2019----